How to Read a Pump Curve – A Must-Know Skill for Every Engineer
💧 One of the most essential tools in pump selection is the pump performance curve. But many engineers overlook how much valuable information it holds.
Here’s a quick breakdown to understand and use it effectively:
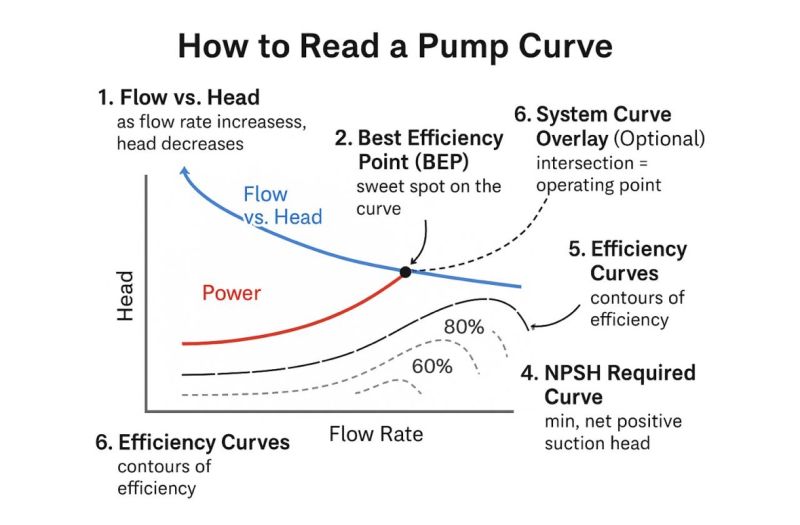
✅ 1. Flow vs. Head
* The core of the curve: as flow rate increases, head decreases. * Helps match your system head curve with the pump’s actual performance.
✅ 2. Best Efficiency Point (BEP)
* The sweet spot of the curve — where the pump runs most efficiently.
* Always try to select a pump that operates close to BEP for longer life and less energy loss.
✅ 3. Power Curve
* Shows how much power the pump will draw at various flow rates.
* Useful for motor sizing and energy analysis.
✅ 4. NPSH Required Curve
* Indicates the minimum NPSH needed to avoid cavitation at each flow rate.
* Make sure your NPSH Available (NPSHa) is higher than this line.
✅ 5. Efficiency Curves
* Overlay lines showing % efficiency zones (60%, 70%, 80%, etc.)
* Great for comparing performance across models.
✅ 6. System Curve Overlay (Optional)
* If available, overlay your system curve on the pump curve.
* The intersection = your operating point. That’s where the pump will perform in reality.
💡 Pro Tip: Understanding pump curves helps you avoid over-sizing, prevent cavitation, and ensure optimal performance in real-world conditions.